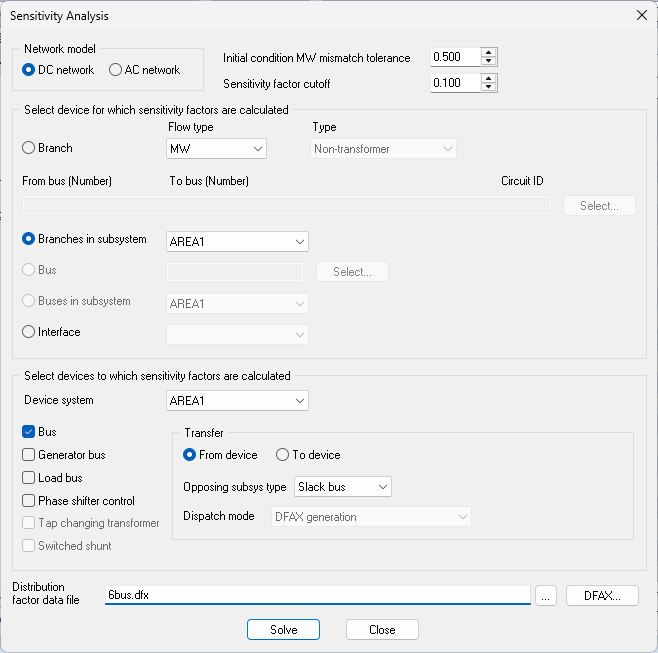
The base version of PSS/E has a really good sensitivity analysis option that can print out all the PTDFs for a system. The trick is - to calculate the FCITC, the ALA module is required. Or is it? First I compute the PTDF using the sensitivity analysis module setup like this.
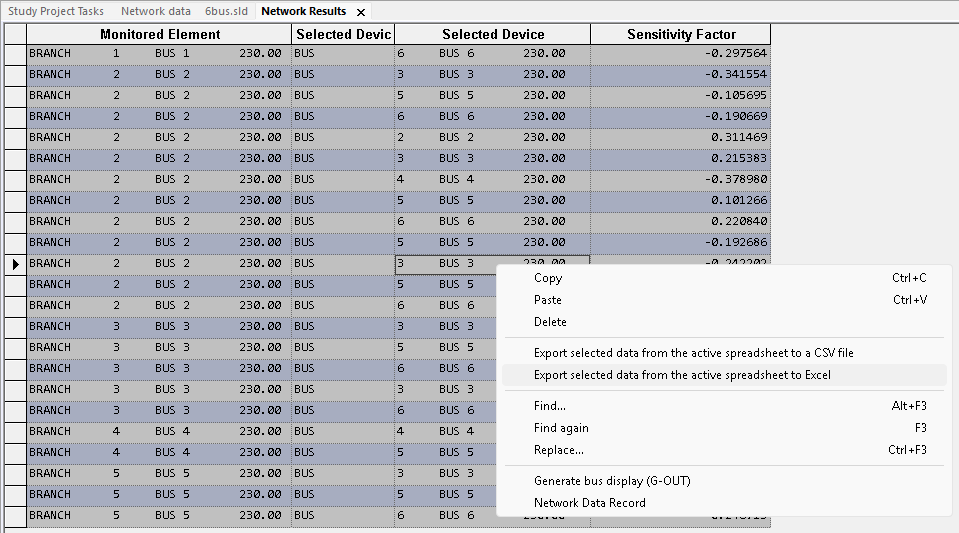
This results in the following table of PTDF. Export this to Excel (or csv if that crashes PSS/E).
Next compute the OTDF so that we can take the N-1 conditions into account as required per the FERC Order.
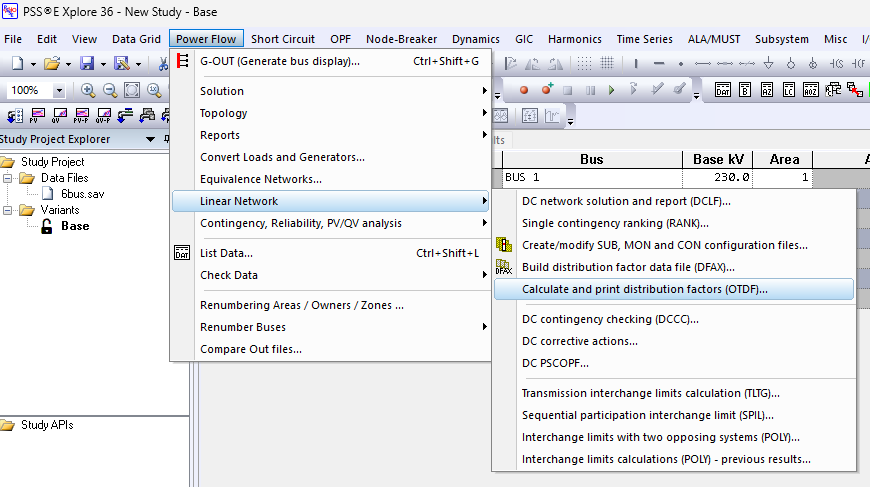
And also export to Excel (or csv).
For each mon/con pair (which PSS/E generates as column A and B in the OTDF table), a compensated PTDF must be computed. This is given by the following equation derived from superposition.
The combined factor contained in the parenthesis is known as the compensated PTDF factor. It represents the change in flow on a mon/con pair given a transfer from A to B. The factor is equal to the additional flow imparted on the monitored line from the project plus the fraction of the additional flow on the contingency caused by the project that would flow on the facility if the contingency were to occur. This value is easy to compute in PowerGEM TARA (though the terminology is not always clear when a PTDF shown is the compensated or uncompensated type) but not easy to compute in PSS/E. As such we must use Excel to perform the required lookups.
Based on the .csv data export from PSS/E, add columns that summarize the from-to bus of each mon and con in the list. Then create a pivot table summary of both the OTDF and PTDF similar to what’s shown in the example below.
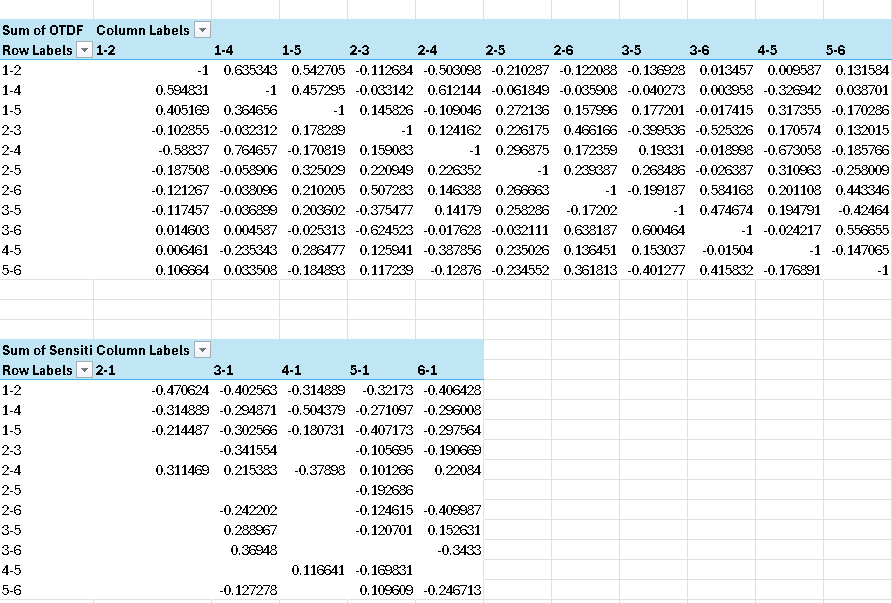
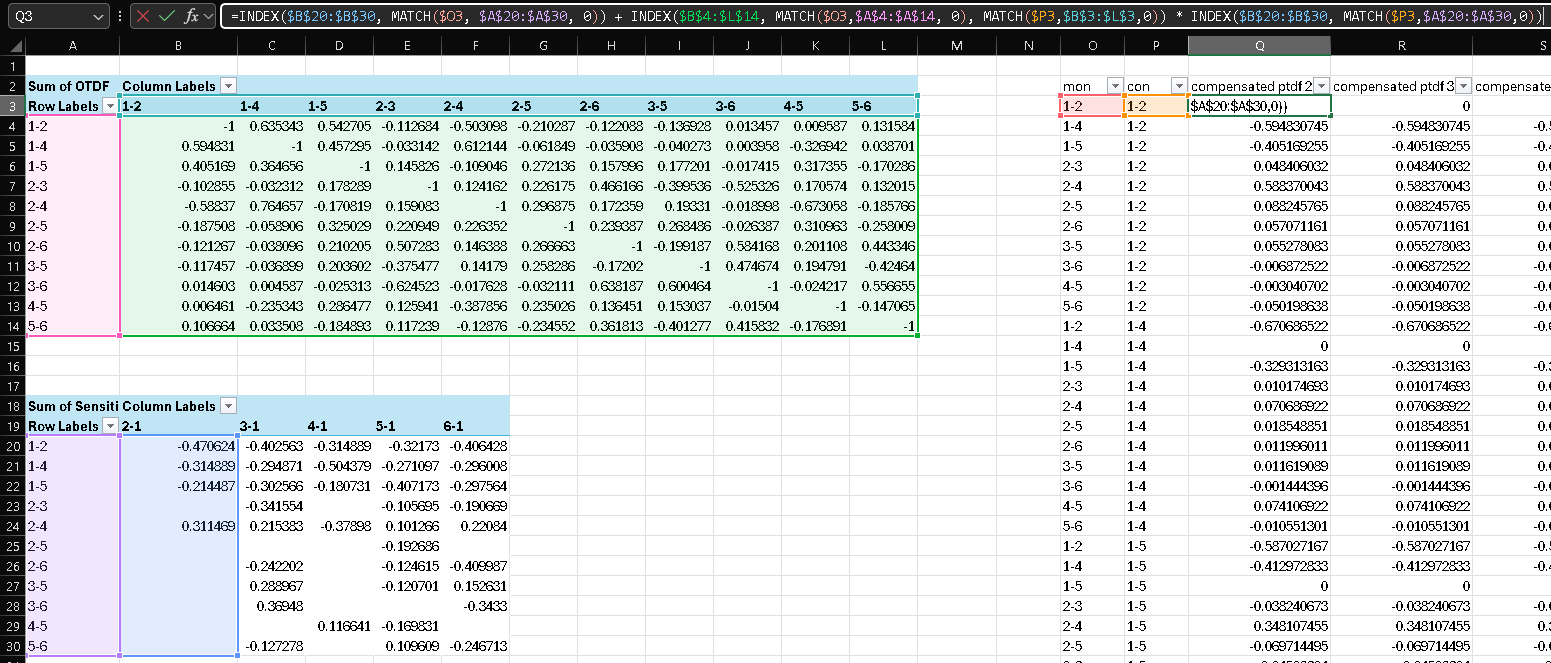
From this, we can create a table of compensated PTDF factors for each mon/con pair.
=INDEX($B$20:$B$30, MATCH($O3, $A$20:$A$30, 0)) + INDEX($B$4:$L$14, MATCH($O3,$A$4:$A$14, 0), MATCH($P3,$B$3:$L$3,0)) * INDEX($B$20:$B$30, MATCH($P3,$A$20:$A$30,0))
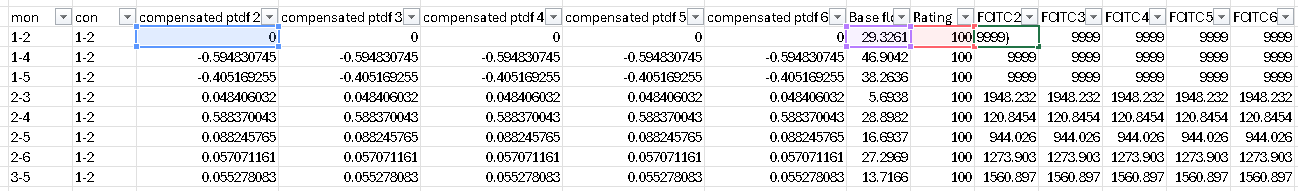
These compensated PTDF factors can be used to predict the post-project, post contingency flow. To compute FCITC for each of these mon/con pairs, we can rearrange the formula for before, setting the predicted post-project post-contingency flow to equal the facility rating. Or in other words, the following equation.
Negative PTDF values should be assigned a maximum FCITC because they are “helpers” that reduce the prevailing flow on the mon/con pair. It is also common to assign a DFAX cutoff of 3% as anything less has a very weak correlation to the mon/con pair.
This yields the following table of FCITC potentials.
=IF(Q3>0.03, ($W3-$V3)/Q3, 9999)
Finally, the FCITC is the minimum value of this function. This can be summarized with a final pivot table.
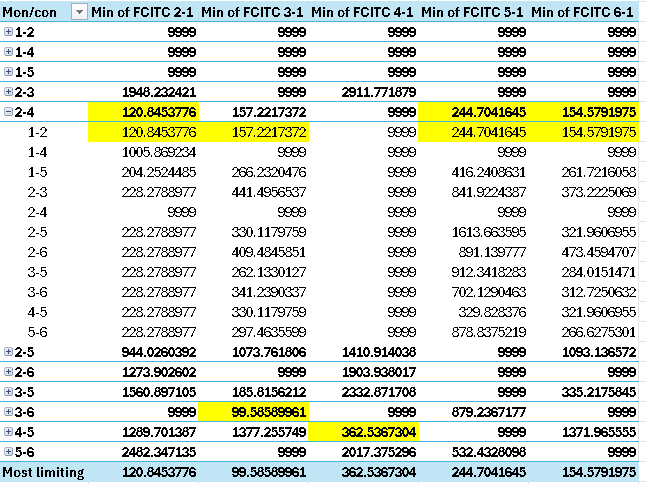
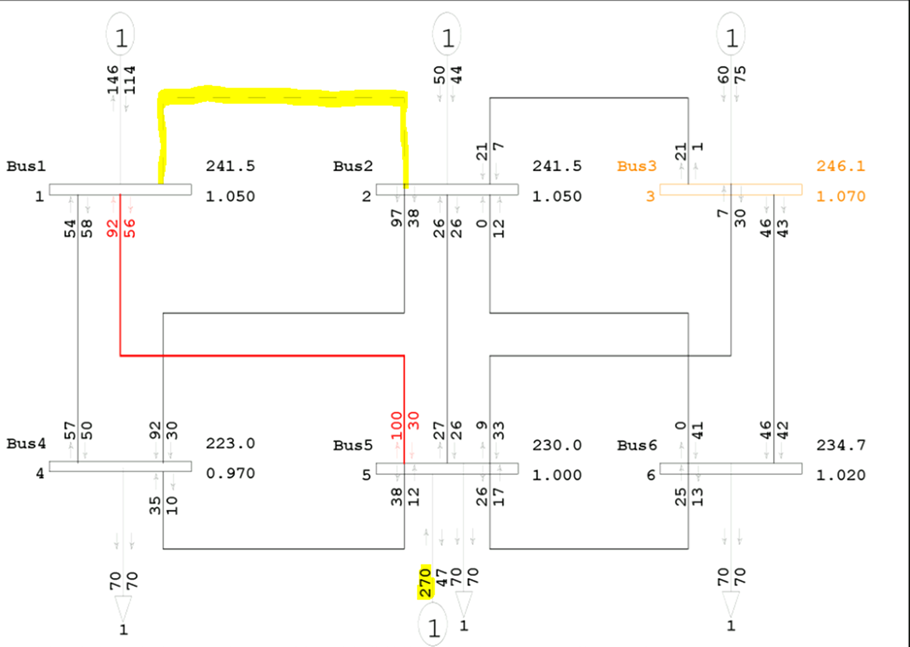
As a benchmark, this method predicts a 5-1 FCITC of 244.7 with most limiting element being line 2-4 for loss of 1-2, PowerGEM TARA’s iterative solver predicts a limit of 268.5, and the theoretical actual limit is 270 MW.