Motivation
Recently, the application of FCITC has become of greater interest due to requirements to post a heatmap of the FCITC at all candidate POIs on a utilities system on a public website.
This article goes into the theory behind how to compute FCITC. Future articles will go over how to complete these calculations using various software packages.
FERC 2023 Requirements
- Utilities must make available on their public website (no fee/NDA) a heatmap (or maybe a form that emails an image of a heatmap) that meets the following requirements.
-
Colored by estimated incremental injection capacity (in MW) by bus
Can fill between with IDW interpolation or coloring facilities
-
Must consider N-1 conditions
-
Tabular output, updated with user-specified MW, voltage, POI (optional POD) with the following values.
- Distribution factor (GSF on most maps, may also include OTDF of worst contingency)
- MW impact on limiting facility (load after-before)
- %loading on limiting facility before
- %loading on limiting facility after
- %impact on limiting facility (after-before)
Not required to identify the contingency name or what the limiting facility is.
Most maps are including limiting facility but not contingency.
What is Incremental Transfer Capability?
FCITC – First Contingency Incremental Transfer Capability is defined by NERC TTC Reference Document 1995 as:
The amount of power, incremental and above normal base transfers, that can be transferred over the interconnected transmission systems in a reliable manner based on all of the following conditions:
- For the existing or planned system configuration, and with normal (precontingency) operating procedures in effect, all facility loadings are within normal ratings and all voltages are within normal limits,
- *The electric systems are capable of absorbing the dynamic power swings, and remaining stable, following a disturbance that results in the loss of any single electric system element, such as a transmission circuit, transformer or generating unit, and,
- After the dynamic power swings subside following a disturbance that results in the loss of any single electric system element as described in 2 above, and after the operation of any automatic operating systems, but before any post-contingency operator-initiated system adjustments are implemented, all transmission facilities loadings are within emergency ratings and all voltages are within emergency limits.
*No tools are currently checking transient stability during calc of FCITC
Choosing a reference bus or POD
- FERC Order requires user-input POI bus, but does not require a specified POD. A transfer requires both a POI and a POD to balance.
- POD could be assumed to be the area or system slack generator – but it may be more beneficial to allow the user to select both. Not available in any industry heatmap examples to date.
- Interconnection process is designed to serve “native load customers” so location of POD can be important. (FERC Pro forma LGIP)
- Additional user-input options for redispatch would make heatmap more useful
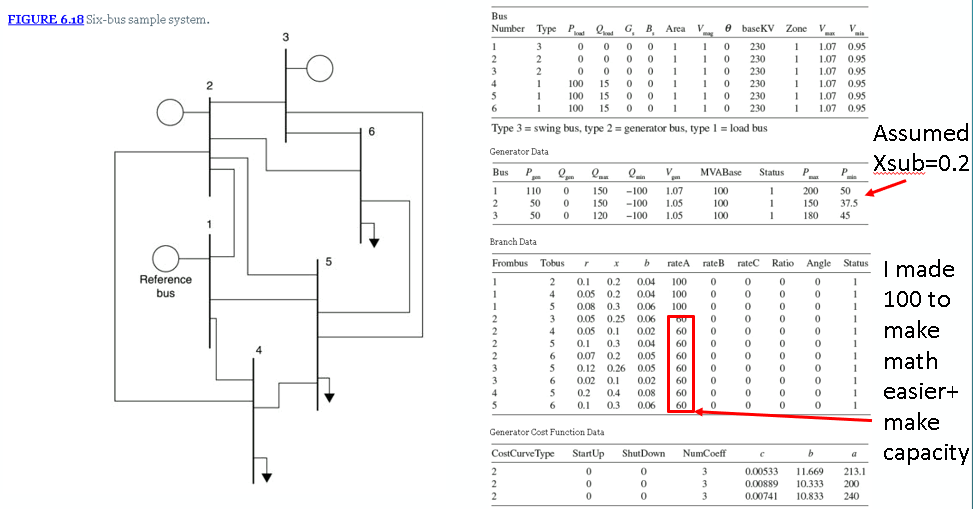
6-bus Example System to Compare Tools
This example is modified from an example on page 293-294 of A.J. Wood, B.F. Wollenberg, POWER GENERATION, OPERATION, AND CONTROL 3rd Edition, John Wiley & Sons, 1984.
Introduction to Shift Factors
Use linear factors to predict the power system
Assumes linearity of a non-linear system therefore large changes can be very inaccurate. Disclaimer warranted
Two factors involved in generating heatmap
- Generation Shift Factor (GSF) aka Power transfer Distribution Factor (PTDF) which is the NERC term.
- Outage transfer distribution factor (OTDF) which is NERC term aka Line Outage Distribution Factor
*I prefer GSF and OTDF to reduce confusion between PTDF/OTDF.
Combining Factors with Superposition
Finding GSF (PTDF) for another POD is given by:
This is equivalent to adding an injection at A and absorption at B. The change at the reference bus cancels out.
The 2nd order term is sometimes left off because GSF*OTDF is a small number.
MonitorFacility is the index of the line with the highest per-unit PredictFlowMW
Accuracy
- For an example injection at Bus 5, the 100 MVA limit of the lines is predicted to overload at 75 MW additional load and 240 MW of generation shifted between bus 1 and 5.
- The actual limits are 80 MW of load and 270 MW of generation.
- The Reference bus only has 107 MW of generation in the base case. Any injection above that implies additional load at the reference bus. This would limit the generation capability to ~100 MW.
- Possibility of selecting multiple PODs, maybe up to 10, using the GSF superposition equation to represent a more complex redispatch?
- Challenges of ensuring rights if giving options to pick POD.